<< Chapter < Page Chapter >> Page >
The figure includes a portion of the electromagnetic spectrum which extends from gamma radiation at the far left through x-ray, ultraviolet, visible, infrared, terahertz, and microwave to broadcast and wireless radio at the far right. At the top of the figure, inside a grey box, are three arrows. The first points left and is labeled, “Increasing energy E.” A second arrow is placed just below the first which also points left and is labeled, “Increasing frequency nu.” A third arrow is placed just below which points right and is labeled, “Increasing wavelength lambda.” Inside the grey box near the bottom is a blue sinusoidal wave pattern that moves horizontally through the box. At the far left end, the waves are short and tightly packed. They gradually lengthen moving left to right across the figure, resulting in significantly longer waves at the right end of the diagram. Beneath the grey box are a variety of photos aligned above the names of the radiation types and a numerical scale that is labeled, “Wavelength lambda ( m ).” This scale runs from 10 superscript negative 12 meters under gamma radiation increasing by powers of ten to a value of 10 superscript 3 meters at the far right under broadcast and wireless radio. X-ray appears around 10 superscript negative 10 meters, ultraviolet appears in the 10 superscript negative 8 to 10 superscript negative 7 range, visible light appears between 10 superscript negative 7 and 10 superscript negative 6, infrared appears in the 10 superscript negative 6 to 10 superscript negative 5 range, teraherz appears in the 10 superscript negative 4 to 10 superscript negative 3 range, microwave infrared appears in the 10 superscript negative 2 to 10 superscript negative 1 range, and broadcast and wireless radio extend from 10 to 10 superscript 3 meters. Labels above the scale are placed to indicate 1 n m at 10 superscript negative 9 meters, 1 micron at 10 superscript negative 6 meters, 1 millimeter at 10 superscript negative 3 meters, 1 centimeter at 10 superscript negative 2 meters, and 1 foot between 10 superscript negative 1 meter and 10 superscript 0 meters. A variety of images are placed beneath the grey box and above the scale in the figure to provide examples of related applications that use the electromagnetic radiation in the range of the scale beneath each image. The photos on the left above gamma radiation show cosmic rays and a multicolor PET scan image of a brain. A black and white x-ray image of a hand appears above x-rays. An image of a patient undergoing dental work, with a blue light being directed into the patient's mouth is labeled, “dental curing,” and is shown above ultraviolet radiation. Between the ultraviolet and infrared labels is a narrow band of violet, indigo, blue, green, yellow, orange, and red colors in narrow, vertical strips. From this narrow band, two dashed lines extend a short distance above to the left and right of an image of the visible spectrum. The image, which is labeled, “visible light,” is just a broader version of the narrow bands of color in the label area. Above infrared are images of a television remote and a black and green night vision image. At the left end of the microwave region, a satellite radar image is shown. Just right of this and still above the microwave region are images of a cell phone, a wireless router that is labeled, “wireless data,” and a microwave oven. Above broadcast and wireless radio are two images. The left most image is a black and white medical ultrasound image. A wireless AM radio is positioned at the far right in the image, also above broadcast and wireless radio.
Portions of the electromagnetic spectrum are shown in order of decreasing frequency and increasing wavelength. Examples of some applications for various wavelengths include positron emission tomography (PET) scans, X-ray imaging, remote controls, wireless Internet, cellular telephones, and radios. (credit “Cosmic ray": modification of work by NASA; credit “PET scan": modification of work by the National Institute of Health; credit “X-ray": modification of work by Dr. Jochen Lengerke; credit “Dental curing": modification of work by the Department of the Navy; credit “Night vision": modification of work by the Department of the Army; credit “Remote": modification of work by Emilian Robert Vicol; credit “Cell phone": modification of work by Brett Jordan; credit “Microwave oven": modification of work by Billy Mabray; credit “Ultrasound": modification of work by Jane Whitney; credit “AM radio": modification of work by Dave Clausen)

Determining the frequency and wavelength of radiation

A sodium streetlight gives off yellow light that has a wavelength of 589 nm (1 nm = 1 × 10 −9 m). What is the frequency of this light?

Solution

We can rearrange the equation c = λν to solve for the frequency:

ν = c λ

Since c is expressed in meters per second, we must also convert 589 nm to meters.

ν = ( 2.998 × 10 8 m s −1 589 nm ) ( 1 × 10 9 nm 1 m ) = 5.09 × 10 14 s −1

Check your learning

One of the frequencies used to transmit and receive cellular telephone signals in the United States is 850 MHz. What is the wavelength in meters of these radio waves?

Answer:

0.353 m = 35.3 cm

Got questions? Get instant answers now!

Wireless communication

This figure consists of three cell phone tower images. The first involves a structure that uses a significant degree of scaffolding. The second image includes a tower with what appears to be a base that is essentially a large pole that branches out at the very top. The third image shows a cell phone tower that appears to be disguised as a palm tree.
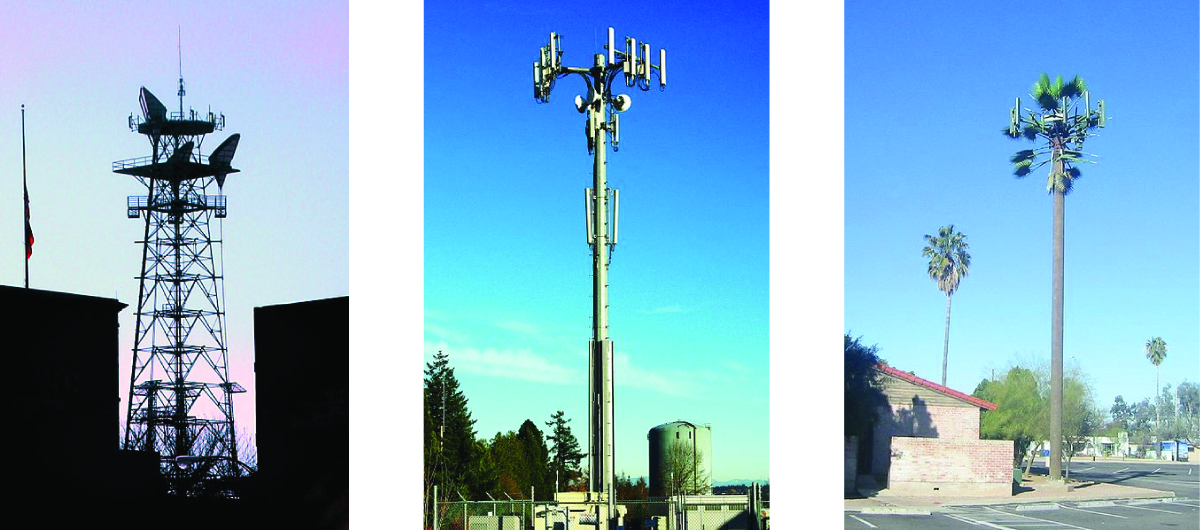
Radio and cell towers are typically used to transmit long-wavelength electromagnetic radiation. Increasingly, cell towers are designed to blend in with the landscape, as with the Tucson, Arizona, cell tower (right) disguised as a palm tree. (credit left: modification of work by Sir Mildred Pierce; credit middle: modification of work by M.O. Stevens)

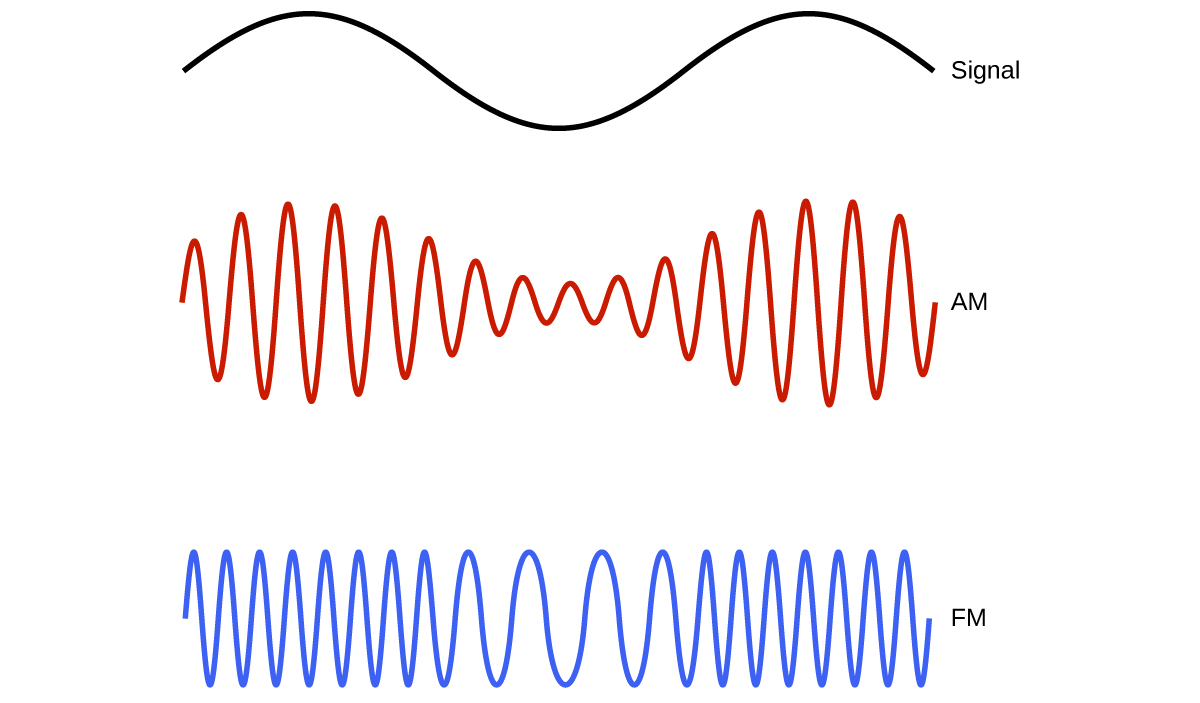
Many valuable technologies operate in the radio (3 kHz-300 GHz) frequency region of the electromagnetic spectrum. At the low frequency (low energy, long wavelength) end of this region are AM (amplitude modulation) radio signals (540-2830 kHz) that can travel long distances. FM (frequency modulation) radio signals are used at higher frequencies (87.5-108.0 MHz). In AM radio, the information is transmitted by varying the amplitude of the wave ( [link] ). In FM radio, by contrast, the amplitude is constant and the instantaneous frequency varies.

This figure shows 3 wave diagrams. The first wave diagram is in black and shows two crests, indicates a consistent distance from peak to trough, and has one trough in its span across the page. The label, “Signal,” appears to the right. Just below this, a wave diagram is shown in red. The wave includes sixteen crests, but the distance from the peaks to troughs of consecutive waves varies moving across the page. The peak to trough distance is greatest in the region below the peaks of the black wave diagram, and the distance from peak to trough is similarly least below the trough of the black wave diagram. This red wave diagram is labeled, “A M.” The third wave diagram is shown in blue. The distance from peak to trough of consecutive waves is constant across the page, but the peaks and troughs are more closely packed in the region below the peaks of the black wave diagram at the top of the figure. The peaks and troughs are relatively widely spaced below the trough region of the black wave diagram. This blue wave diagram is labeled “F M.”
This schematic depicts how amplitude modulation (AM) and frequency modulation (FM) can be used to transmit a radio wave.

Other technologies also operate in the radio-wave portion of the electromagnetic spectrum. For example, 4G cellular telephone signals are approximately 880 MHz, while Global Positioning System (GPS) signals operate at 1.228 and 1.575 GHz, local area wireless technology (Wi-Fi) networks operate at 2.4 to 5 GHz, and highway toll sensors operate at 5.8 GHz. The frequencies associated with these applications are convenient because such waves tend not to be absorbed much by common building materials.

Questions & Answers

Discuss the differences between taste and flavor, including how other sensory inputs contribute to our  perception of flavor.
John Reply
taste refers to your understanding of the flavor . while flavor one The other hand is refers to sort of just a blend things.
Faith
While taste primarily relies on our taste buds, flavor involves a complex interplay between taste and aroma
Kamara
which drugs can we use for ulcers
Ummi Reply
omeprazole
Kamara
what
Renee
what is this
Renee
is a drug
Kamara
of anti-ulcer
Kamara
Omeprazole Cimetidine / Tagament For the complicated once ulcer - kit
Patrick
what is the function of lymphatic system
Nency Reply
Not really sure
Eli
to drain extracellular fluid all over the body.
asegid
The lymphatic system plays several crucial roles in the human body, functioning as a key component of the immune system and contributing to the maintenance of fluid balance. Its main functions include: 1. Immune Response: The lymphatic system produces and transports lymphocytes, which are a type of
asegid
to transport fluids fats proteins and lymphocytes to the blood stream as lymph
Adama
what is anatomy
Oyindarmola Reply
Anatomy is the identification and description of the structures of living things
Kamara
what's the difference between anatomy and physiology
Oyerinde Reply
Anatomy is the study of the structure of the body, while physiology is the study of the function of the body. Anatomy looks at the body's organs and systems, while physiology looks at how those organs and systems work together to keep the body functioning.
AI-Robot
what is enzymes all about?
Mohammed Reply
Enzymes are proteins that help speed up chemical reactions in our bodies. Enzymes are essential for digestion, liver function and much more. Too much or too little of a certain enzyme can cause health problems
Kamara
yes
Prince
how does the stomach protect itself from the damaging effects of HCl
Wulku Reply
little girl okay how does the stomach protect itself from the damaging effect of HCL
Wulku
it is because of the enzyme that the stomach produce that help the stomach from the damaging effect of HCL
Kamara
function of digestive system
Ali Reply
function of digestive
Ali
the diagram of the lungs
Adaeze Reply
what is the normal body temperature
Diya Reply
37 degrees selcius
Xolo
37°c
Stephanie
please why 37 degree selcius normal temperature
Mark
36.5
Simon
37°c
Iyogho
the normal temperature is 37°c or 98.6 °Fahrenheit is important for maintaining the homeostasis in the body the body regular this temperature through the process called thermoregulation which involves brain skin muscle and other organ working together to maintain stable internal temperature
Stephanie
37A c
Wulku
what is anaemia
Diya Reply
anaemia is the decrease in RBC count hemoglobin count and PVC count
Eniola
what is the pH of the vagina
Diya Reply
how does Lysin attack pathogens
Diya
acid
Mary
I information on anatomy position and digestive system and there enzyme
Elisha Reply
anatomy of the female external genitalia
Muhammad Reply
Organ Systems Of The Human Body (Continued) Organ Systems Of The Human Body (Continued)
Theophilus Reply
what's lochia albra
Kizito
Got questions? Join the online conversation and get instant answers!
Jobilize.com Reply

Get Jobilize Job Search Mobile App in your pocket Now!

Get it on Google Play Download on the App Store Now


Source:  OpenStax, Chemistry. OpenStax CNX. May 20, 2015 Download for free at http://legacy.cnx.org/content/col11760/1.9
Google Play and the Google Play logo are trademarks of Google Inc.

Notification Switch

Would you like to follow the 'Chemistry' conversation and receive update notifications?

Ask