<< Chapter < Page Chapter >> Page >
A line graph of sensitivity on y axis and wavelength on x axis is shown. The graph depicts three skewed curves, representing three types of cones and each type is sensitive to different ranges of wavelengths. The range of wavelength is between three hundred and fifty to seven hundred nanometers. For blue range, the curve peaks at four hundred and twenty nanometers and sensitivity is zero point two. For green range, the curve peaks at five hundred and twenty nanometers and the sensitivity is shown to be one point zero. For yellow range, the curve peaks at five hundred and ninety nanometers and sensitivity is at one point zero.
The image shows the relative sensitivity of the three types of cones, which are named according to wavelengths of greatest sensitivity. Rods are about 1000 times more sensitive, and their curve peaks at about 500 nm. Evidence for the three types of cones comes from direct measurements in animal and human eyes and testing of color blind people.

Consider why various objects display color—that is, why are feathers blue and red in a crimson rosella? The true color of an object is defined by its absorptive or reflective characteristics. [link] shows white light falling on three different objects, one pure blue, one pure red, and one black, as well as pure red light falling on a white object. Other hues are created by more complex absorption characteristics. Pink, for example on a galah cockatoo, can be due to weak absorption of all colors except red. An object can appear a different color under non-white illumination. For example, a pure blue object illuminated with pure red light will appear black, because it absorbs all the red light falling on it. But, the true color of the object is blue, which is independent of illumination.

Four flat rectangular structures, named as Blue object, Red object, Black object, and White object are shown. The red, blue, and black objects are illuminated by white light shown by six rays of red, orange, yellow, green, blue, and violet. The blue rectangle is emitting blue ray and it appears blue. The red rectangle is emitting red ray and it appears red while the black rectangle has absorbed all colors and appears black. The white rectangle is illuminated only by red light and emits red ray but appears white.
Absorption characteristics determine the true color of an object. Here, three objects are illuminated by white light, and one by pure red light. White is the equal mixture of all visible wavelengths; black is the absence of light.

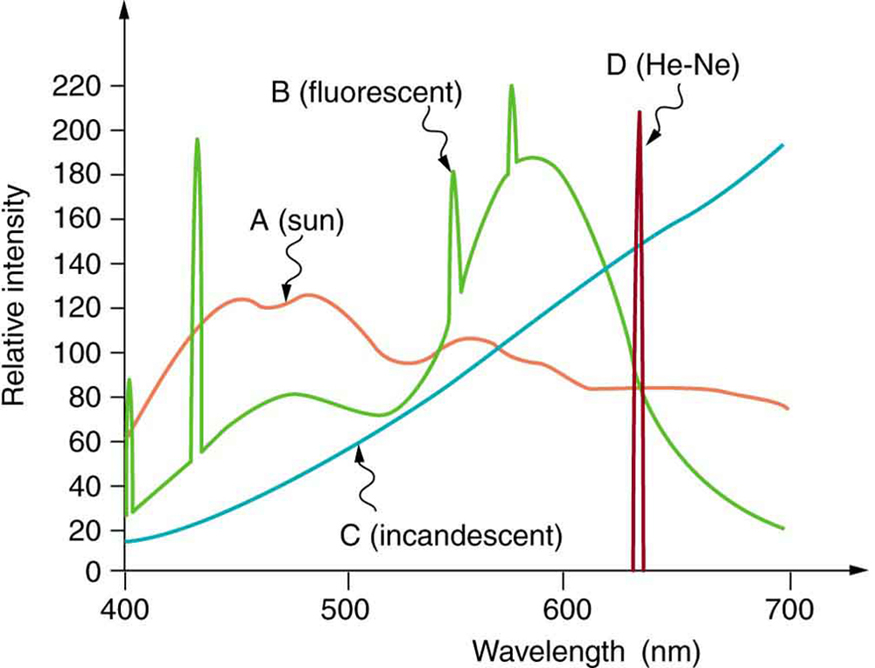
Similarly, light sources have colors that are defined by the wavelengths they produce. A helium-neon laser emits pure red light. In fact, the phrase “pure red light” is defined by having a sharp constrained spectrum, a characteristic of laser light. The Sun produces a broad yellowish spectrum, fluorescent lights emit bluish-white light, and incandescent lights emit reddish-white hues as seen in [link] . As you would expect, you sense these colors when viewing the light source directly or when illuminating a white object with them. All of this fits neatly into the simplified theory that a combination of wavelengths produces various hues.

Take-home experiment: exploring color addition

This activity is best done with plastic sheets of different colors as they allow more light to pass through to our eyes. However, thin sheets of paper and fabric can also be used. Overlay different colors of the material and hold them up to a white light. Using the theory described above, explain the colors you observe. You could also try mixing different crayon colors.

Four curves showing emission spectra for light sources like the Sun shown as curve A, fluorescent light source shown as curve B, incandescent light source as curve C, and helium-neon laser light source as curve D are depicted in a relative intensity versus wavelength graph. Curve A is a simple curve. Curve B has four spikes at different intensity. Curve C is a linear curve. Curve D is represented as a spike with relative intensity around two hundred and twenty on the scale of zero to two hundred and twenty and wavelength around six hundred and twenty nanometers.
Emission spectra for various light sources are shown. Curve A is average sunlight at Earth’s surface, curve B is light from a fluorescent lamp, and curve C is the output of an incandescent light. The spike for a helium-neon laser (curve D) is due to its pure wavelength emission. The spikes in the fluorescent output are due to atomic spectra—a topic that will be explored later.

Color constancy and a modified theory of color vision

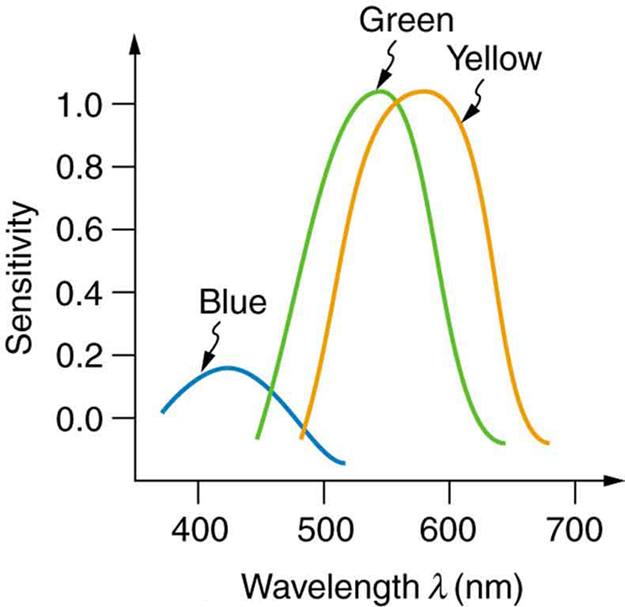
The eye-brain color-sensing system can, by comparing various objects in its view, perceive the true color of an object under varying lighting conditions—an ability that is called color constancy    . We can sense that a white tablecloth, for example, is white whether it is illuminated by sunlight, fluorescent light, or candlelight. The wavelengths entering the eye are quite different in each case, as the graphs in [link] imply, but our color vision can detect the true color by comparing the tablecloth with its surroundings.

Questions & Answers

if three forces F1.f2 .f3 act at a point on a Cartesian plane in the daigram .....so if the question says write down the x and y components ..... I really don't understand
Syamthanda Reply
hey , can you please explain oxidation reaction & redox ?
Boitumelo Reply
hey , can you please explain oxidation reaction and redox ?
Boitumelo
for grade 12 or grade 11?
Sibulele
the value of V1 and V2
Tumelo Reply
advantages of electrons in a circuit
Rethabile Reply
we're do you find electromagnetism past papers
Ntombifuthi
what a normal force
Tholulwazi Reply
it is the force or component of the force that the surface exert on an object incontact with it and which acts perpendicular to the surface
Sihle
what is physics?
Petrus Reply
what is the half reaction of Potassium and chlorine
Anna Reply
how to calculate coefficient of static friction
Lisa Reply
how to calculate static friction
Lisa
How to calculate a current
Tumelo
how to calculate the magnitude of horizontal component of the applied force
Mogano
How to calculate force
Monambi
a structure of a thermocouple used to measure inner temperature
Anna Reply
a fixed gas of a mass is held at standard pressure temperature of 15 degrees Celsius .Calculate the temperature of the gas in Celsius if the pressure is changed to 2×10 to the power 4
Amahle Reply
How is energy being used in bonding?
Raymond Reply
what is acceleration
Syamthanda Reply
a rate of change in velocity of an object whith respect to time
Khuthadzo
how can we find the moment of torque of a circular object
Kidist
Acceleration is a rate of change in velocity.
Justice
t =r×f
Khuthadzo
how to calculate tension by substitution
Precious Reply
hi
Shongi
hi
Leago
use fnet method. how many obects are being calculated ?
Khuthadzo
khuthadzo hii
Hulisani
how to calculate acceleration and tension force
Lungile Reply
you use Fnet equals ma , newtoms second law formula
Masego
please help me with vectors in two dimensions
Mulaudzi Reply
how to calculate normal force
Mulaudzi
Got questions? Join the online conversation and get instant answers!
Jobilize.com Reply
Practice Key Terms 6

Get Jobilize Job Search Mobile App in your pocket Now!

Get it on Google Play Download on the App Store Now


Source:  OpenStax, College physics. OpenStax CNX. Jul 27, 2015 Download for free at http://legacy.cnx.org/content/col11406/1.9
Google Play and the Google Play logo are trademarks of Google Inc.

Notification Switch

Would you like to follow the 'College physics' conversation and receive update notifications?

Ask