

| << Chapter < Page | Chapter >> Page > |
Sketch a graph of alongside its parent function. Include the key points and asymptotes on the graph. State the domain, range, and asymptote.
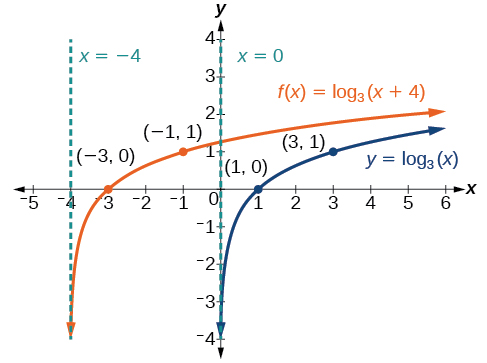
The domain is the range and the asymptote
When a constant is added to the parent function the result is a vertical shift units in the direction of the sign on To visualize vertical shifts, we can observe the general graph of the parent function alongside the shift up, and the shift down, See [link] .
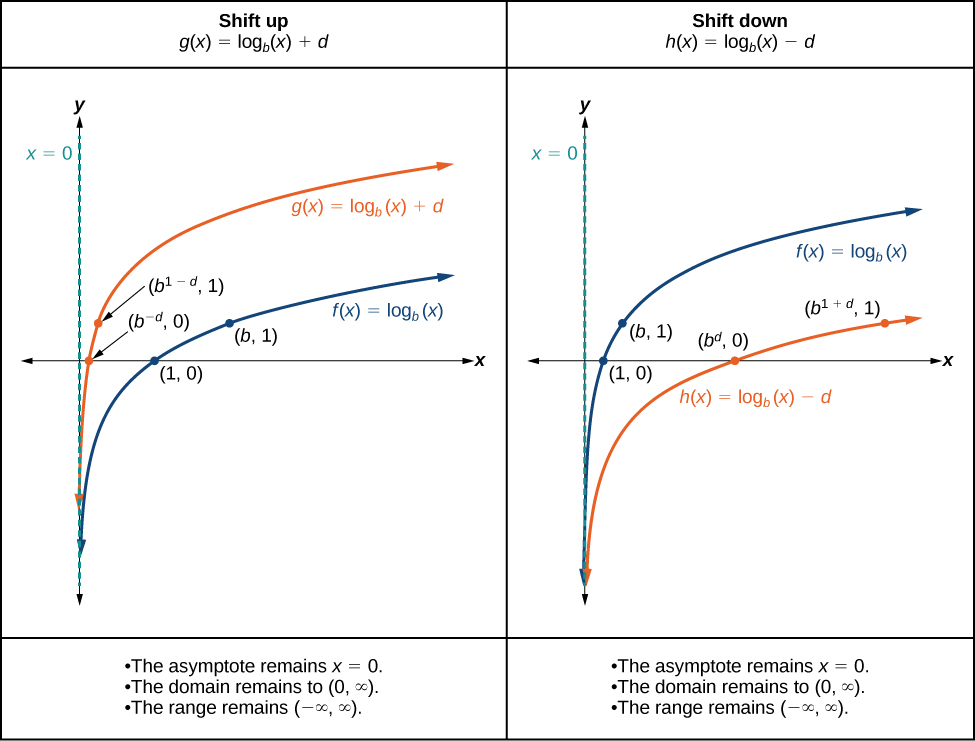
For any constant the function
Given a logarithmic function with the form graph the translation.
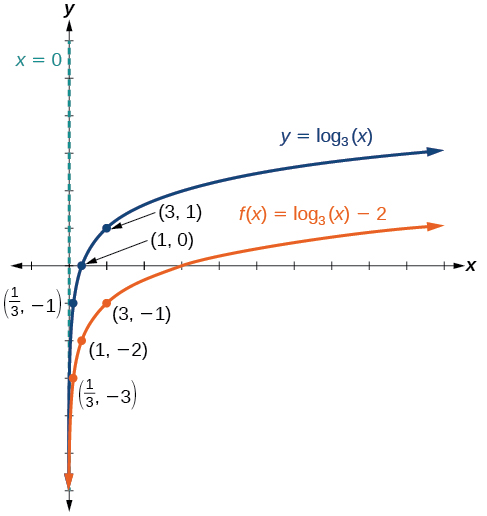
Sketch a graph of alongside its parent function. Include the key points and asymptote on the graph. State the domain, range, and asymptote.
Since the function is we will notice Thus
This means we will shift the function down 2 units.
The vertical asymptote is
Consider the three key points from the parent function, and
The new coordinates are found by subtracting 2 from the y coordinates.
Label the points and
The domain is the range is and the vertical asymptote is
The domain is the range is and the vertical asymptote is
Sketch a graph of alongside its parent function. Include the key points and asymptote on the graph. State the domain, range, and asymptote.
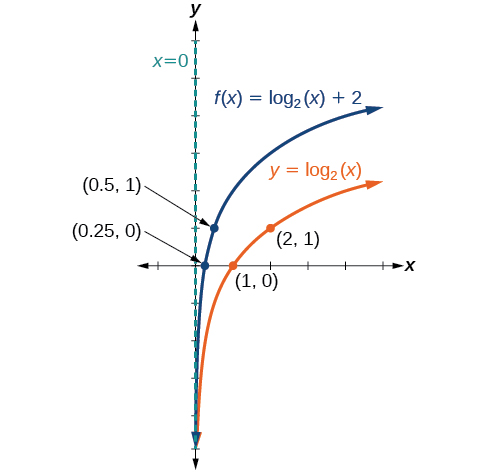
The domain is the range is and the vertical asymptote is
When the parent function is multiplied by a constant the result is a vertical stretch or compression of the original graph. To visualize stretches and compressions, we set and observe the general graph of the parent function alongside the vertical stretch, and the vertical compression, See [link] .
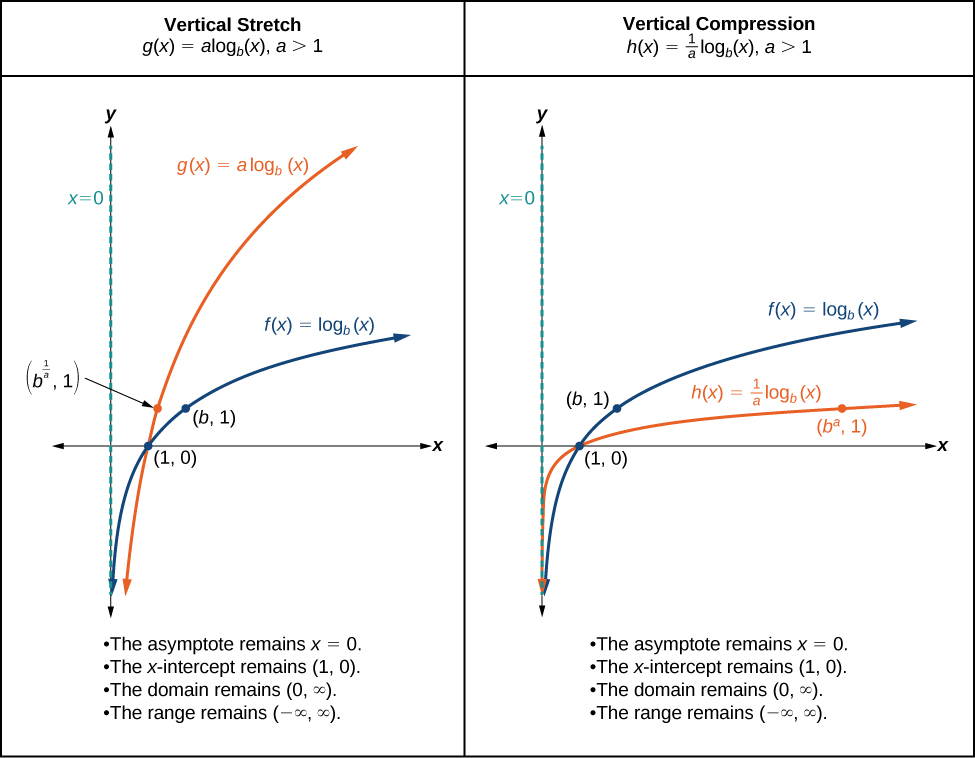
For any constant the function
Notification Switch
Would you like to follow the 'Algebra and trigonometry' conversation and receive update notifications?

|
|
|
|
|

|
|
|
|

|
|

|
|

|
|
|
|

|
|

|
|

|
|

|